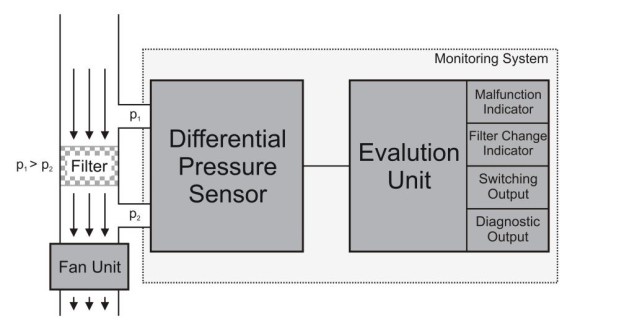
 Figure 1: A Simple HVAC Monitoring System Based on a Differential Pressure Sensor
In this application note Analog Microelectronics GmbH proposes the use of the OEM pressure sensor / switch AMS 5105 in HVAC filter and fan monitoring units. By presenting four different examples this application note illustrates how AMS 5105 can be used in HVAC monitoring units to detect malfunctions as well as the right time to change the filter.
In general the filters used in HVAC systems and especially their air flow resistance have a strong influence on the system’s energy efficiency. The filter’s air flow resistance is determined by the filter’s construction (e.g. filter type, dimension and MERV rating) and its condition (the amount of contaminants captured in the filter). To monitor a filter’s condition in HVAC units it became common to use filter monitoring systems instead of replacing a filter after a certain amount of time.
A simple HVAC monitoring system is shown in Figure 1. It consists of a differential pressure sensor and a more or less complex evaluation unit. The pressure sensor monitors the air flow through the HVAC system’s ducts by measuring the pressure difference between the upstream and downstream part of a filter. As long as the fan unit is working at constant speed and the filter is mounted properly, the current air flow in the ducts depends on the used filter type and the filter’s condition. The filter’s type defines the initial pressure difference, which is measured if a new filter is used in a given HVAC system. During operation the filter collects contaminants from the air flowing through the HVAC system, which leads to a gradual increase in the filter’s air flow resistance. As a rule of thumb a filter should be replaced if the pressure difference measured across the filter is twice the initial pressure difference [1].
The system shown in Figure 1 can also be used to monitor errors or malfunctions in the HVAC system: If the measured pressure difference is smaller than the initial pressure difference the filter may be ruptured, not properly mounted, the fan unit might malfunction or the ducts could have a leak.
Figure 1: A Simple HVAC Monitoring System Based on a Differential Pressure SensorTo simplify the evaluation unit and to supersede the use of a microcontroller in such an HVAC monitoring system Analog Microelectronics proposes the use of AMS 5105. This board mountable OEM pressure sen-sor is calibrated and temperature compensated and features an analog ratiometric 0.5 .. 4.5 V output along with two discrete, programmable logic switching ports, which are able to drive 4 mA. For each switching port the switching function, threshold, hysteresis and delay can be set individually as described in AMS 5105’s datasheet [2] and the User Guide: USB starter kit AMS 5105 [3]. With its low differential pressure variants from 100 mbar down to 5 mbar full scale AMS 5105 is ideal for the use in filter and fan monitoring systems. Using AMS 5105 a malfunction and filter change indicator as well as switching and diagnostic outputs can easily be realized.
A simple filter monitoring system with pre-warning function using AMS 5105 and a few external components is shown in Figure 2. In this circuit AMS 5105 has to be powered with a supply voltage of 5 V. The sensor's pressure port 1 is connected to the filter’s upstream side and pressure port 2 to the downstream side. Two LEDs are used to monitor the filter’s condition. LED 1 at the first switching output SWITCH 1 is used to indicate that the filter has to be replaced soon and LED 2 at the second switching output SWITCH 2 indicates that the filter has to be replaced immediately.
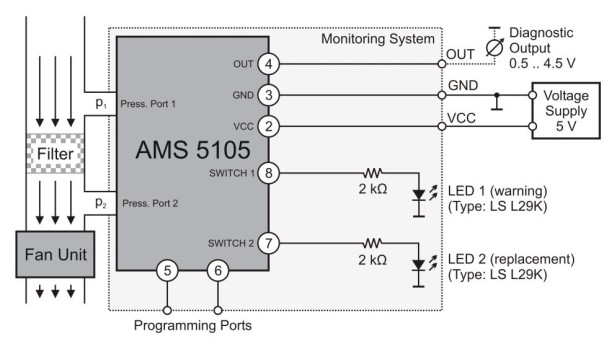 Figure 2: Simple HVAC Filter Monitoring System with Pre-Warning using AMS 5105
In this example both of AMS 5105’s switching ports are programmed as normally open and the hysteresis is typically set to 5 % of the calibrated pressure range. Using the initial pressure difference Δpini measured when a new filter free from contaminants is used, the threshold for SWITCH 1 is programmed to a warning level at e.g. 1.75∙Δpini and SWITCH 2’s threshold is set to 2∙Δpini typically. So LED 1 turns on if the differential pressure measured by AMS 5105 exceeds the before mentioned pre-warning threshold for SWITCH 1 and LED 2 lights up if the differential pressure measured across the filter is typically larger than 2∙Δpini, showing that the filter has to be replaced.
The analog output voltage signal can be used for diagnostic purposes and may be readout using a voltmeter. If the analog voltage output is lower than the corresponding value for a fresh filter element a malfunction occurred in the HVAC filtration system. This can be a ruptured filter, a leak in the ducts, a malfunctioning fan unit or a bypassed filter.
For applications where only an industrial 24 V supply is available the circuit above can easily be adapted. Figure 3 shows the proposed circuit for a filter monitoring system, which can be powered with a 7 .. 36 V DC voltage supply and which is additionally able to drive currents up to 0.7 A at its power MOSFET driven switching outputs S1 and S2. These outputs can be used to power a warning siren or an actuator (e.g. for throttle valves). Furthermore the system is protected against short circuit due to the used components.
Using the power MOSFET BSP 452 [5] the outputs S1 and S2 follow AMS 5105’s programmed switching functions. Therefore the settings from Example 1 can be used for the switching outputs SWITCH 1 and SWITCH 2. This leads to LED 1 lighting up and the load connected to S1 being powered if the differential pressure measured by AMS 5105 exceeds 1.75 times the initial pressure Δpini. If the differential pressure reaches 2∙Δpini, LED 2 lights up and the load connected to S2 is powered.
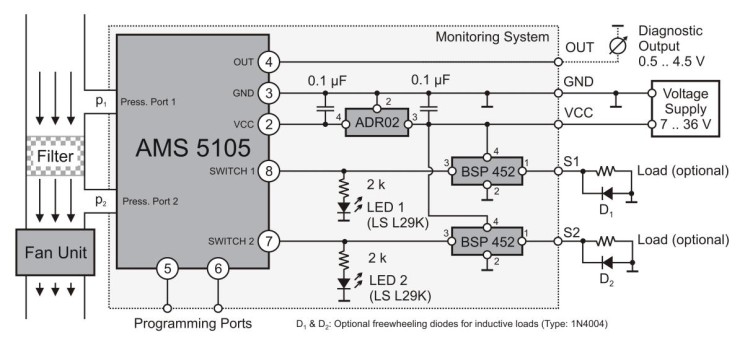 Figure 3: HVAC Filter Monitoring System with Robust Switching Outputs
If an application requires a low side switch, which switches GND instead of VCC, BSP 75N [6] can be used instead of BSP 452. In this case the load has to be connected to the supply voltage directly and the load’s low side is connected to BSP 75N.
Using the circuits in Example 1 and 2 it is possible to indicate if the filter has to be replaced soon and if the filter has reached its end of life and has to be replaced immediately. Possible malfunctions in the system can only be detected if the analog diagnostic output is used. By using the circuit shown in Figure 3 and adapting AMS 5105’s programmed switching function and thresholds malfunctions leading to pressure differences smaller than the initial pressure difference as well as the right time to change the filter can be detected.
For this purpose it is useful to select a differential type of AMS 5105 with a pressure range of about 5 times the initial pressure difference Δpini, measured for a new and properly mounted filter of a specific type. AMS 5105’s SWITCH 1 is programmed as normally close and its threshold is set to 0.95∙Δpini. SWITCH 2 is pro-grammed as normally open and the threshold is set to 2∙Δpini. Both ports’ hysteresis is typically set to 1 % of the calibrated pressure range, which is about 5 % of Δpini. As a consequence SWITCH 1 opens at 0.95∙Δpini for rising pressure and closes at 0.9∙Δpini for falling pressure. SWITCH 2 closes at 2∙Δpini for rising pressure and closes at 1.95∙Δpini for falling pressure.
Using these settings both LEDs and S1, S2 are off if no malfunction occurred and the filter is not end of life. If the differential pressure measured across the filter exceeds 2∙Δpini LED 2 lights up and the load connected to S2 is powered indicating that the filter has to be replaced. LED 1 turns on and the load at S1 is powered if a malfunction occurs which significantly reduces the actual measured pressure difference below Δpini and the pressure difference drops below 0.9∙Δpini. These malfunctions include a failure of fan, a leak in the ducts, a ruptured or a bypassed filter.
Alternatively AMS 5105’s switching ports can be programmed to window mode, see the User Guide: USB starter kit AMS 5105 [3], while the settings for the switching threshold and hysteresis of SWITCH 1 and SWITCH 2 are used as described above. In this case LED 1 indicates a properly working HVAC system and LED 2 lights up, if the filter has reached its end of life or a malfunction occurred, which reduces the actual pressure difference below 0.9∙Δpini.
For this purpose the same electrical circuit as in Example 2 can be used, only the pressure measurement method is changed. Instead of measuring the pressure difference between the filter’s upstream und down-stream side, the pressure drop resulting from the air flow in the system is measured across an orifice. Using this setup the upstream filter protects the sensor from contaminants.
Now AMS 5105’s pressure port 1 is connected to the orifice’s upstream side between the filter and orifice and port 2 to the orifice’s downstream side. In contrast to the examples given before, the pressure drop across the orifice decreases if the filter’s air flow resistance increases: At constant fan speed the air flow through a new, properly mounted filter is larger than the air flow through a filter, which has reached its end of life. The decreasing air flow leads to a decreasing pressure difference at the orifice.
Due to the non-linear relationship between the air flow through the filter and the pressure drop at the orifice, the thresholds from the previous examples cannot be used anymore. For each specific setup the initial pres-sure difference, the pressure difference indicating the filter’s end of life and the resulting thresholds for AMS 5105 have to be determined individually.
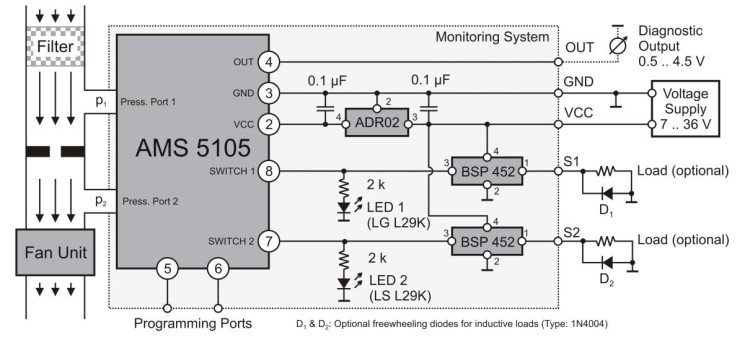 Figure 4: HVAC Filter Monitoring System with Pressure Measurement at an Orifice
 | |
 |  Monitoring HVAC filter and fan units using AMS 5105 Monitoring HVAC filter and fan units using AMS 5105In this application note Analog Microelectronics GmbH proposes the use of the OEM pressure sensor / switch AMS 5105 in HVAC filter and fan monitoring units. By presenting four different examples this application note illustrates how AMS 5105 can be used in HVAC monitoring units to detect malfunctions as well as the right time to change the filter. In general the filters used in HVAC systems and especially their air flow resistance have a strong influence on the system’s energy efficiency. The filter’s air flow resistance is determined by the filter’s construction (e.g. filter type, dimension and MERV rating) and its condition (the amount of contaminants captured in the filter). To monitor a filter’s condition in HVAC units it became common to use filter monitoring systems instead of replacing a filter after a certain amount of time. A simple HVAC monitoring system is shown in Figure 1. It consists of a differential pressure sensor and a more or less complex evaluation unit. The pressure sensor monitors the air flow through the HVAC system’s ducts by measuring the pressure difference between the upstream and downstream part of a filter. As long as the fan unit is working at constant speed and the filter is mounted properly, the current air flow in the ducts depends on the used filter type and the filter’s condition. The filter’s type defines the initial pressure difference, which is measured if a new filter is used in a given HVAC system. During operation the filter collects contaminants from the air flowing through the HVAC system, which leads to a gradual increase in the filter’s air flow resistance. As a rule of thumb a filter should be replaced if the pressure difference measured across the filter is twice the initial pressure difference [1]. The system shown in Figure 1 can also be used to monitor errors or malfunctions in the HVAC system: If the measured pressure difference is smaller than the initial pressure difference the filter may be ruptured, not properly mounted, the fan unit might malfunction or the ducts could have a leak. Figure 1: A Simple HVAC Monitoring System Based on a Differential Pressure SensorTo simplify the evaluation unit and to supersede the use of a microcontroller in such an HVAC monitoring system Analog Microelectronics proposes the use of AMS 5105. This board mountable OEM pressure sen-sor is calibrated and temperature compensated and features an analog ratiometric 0.5 .. 4.5 V output along with two discrete, programmable logic switching ports, which are able to drive 4 mA. For each switching port the switching function, threshold, hysteresis and delay can be set individually as described in AMS 5105’s datasheet [2] and the User Guide: USB starter kit AMS 5105 [3]. With its low differential pressure variants from 100 mbar down to 5 mbar full scale AMS 5105 is ideal for the use in filter and fan monitoring systems. Using AMS 5105 a malfunction and filter change indicator as well as switching and diagnostic outputs can easily be realized. Example 1: Simple HVAC Filter Monitoring System with Pre-WarningA simple filter monitoring system with pre-warning function using AMS 5105 and a few external components is shown in Figure 2. In this circuit AMS 5105 has to be powered with a supply voltage of 5 V. The sensor's pressure port 1 is connected to the filter’s upstream side and pressure port 2 to the downstream side. Two LEDs are used to monitor the filter’s condition. LED 1 at the first switching output SWITCH 1 is used to indicate that the filter has to be replaced soon and LED 2 at the second switching output SWITCH 2 indicates that the filter has to be replaced immediately. Figure 2: Simple HVAC Filter Monitoring System with Pre-Warning using AMS 5105In this example both of AMS 5105’s switching ports are programmed as normally open and the hysteresis is typically set to 5 % of the calibrated pressure range. Using the initial pressure difference Δpini measured when a new filter free from contaminants is used, the threshold for SWITCH 1 is programmed to a warning level at e.g. 1.75∙Δpini and SWITCH 2’s threshold is set to 2∙Δpini typically. So LED 1 turns on if the differential pressure measured by AMS 5105 exceeds the before mentioned pre-warning threshold for SWITCH 1 and LED 2 lights up if the differential pressure measured across the filter is typically larger than 2∙Δpini, showing that the filter has to be replaced. The analog output voltage signal can be used for diagnostic purposes and may be readout using a voltmeter. If the analog voltage output is lower than the corresponding value for a fresh filter element a malfunction occurred in the HVAC filtration system. This can be a ruptured filter, a leak in the ducts, a malfunctioning fan unit or a bypassed filter. Example 2: HVAC Filter Monitoring System 24 V Supply and Robust OutputsFor applications where only an industrial 24 V supply is available the circuit above can easily be adapted. Figure 3 shows the proposed circuit for a filter monitoring system, which can be powered with a 7 .. 36 V DC voltage supply and which is additionally able to drive currents up to 0.7 A at its power MOSFET driven switching outputs S1 and S2. These outputs can be used to power a warning siren or an actuator (e.g. for throttle valves). Furthermore the system is protected against short circuit due to the used components. Using the power MOSFET BSP 452 [5] the outputs S1 and S2 follow AMS 5105’s programmed switching functions. Therefore the settings from Example 1 can be used for the switching outputs SWITCH 1 and SWITCH 2. This leads to LED 1 lighting up and the load connected to S1 being powered if the differential pressure measured by AMS 5105 exceeds 1.75 times the initial pressure Δpini. If the differential pressure reaches 2∙Δpini, LED 2 lights up and the load connected to S2 is powered. Figure 3: HVAC Filter Monitoring System with Robust Switching OutputsIf an application requires a low side switch, which switches GND instead of VCC, BSP 75N [6] can be used instead of BSP 452. In this case the load has to be connected to the supply voltage directly and the load’s low side is connected to BSP 75N. Example 3: HVAC Filter and Fan Monitoring System with DiagnosticsUsing the circuits in Example 1 and 2 it is possible to indicate if the filter has to be replaced soon and if the filter has reached its end of life and has to be replaced immediately. Possible malfunctions in the system can only be detected if the analog diagnostic output is used. By using the circuit shown in Figure 3 and adapting AMS 5105’s programmed switching function and thresholds malfunctions leading to pressure differences smaller than the initial pressure difference as well as the right time to change the filter can be detected. For this purpose it is useful to select a differential type of AMS 5105 with a pressure range of about 5 times the initial pressure difference Δpini, measured for a new and properly mounted filter of a specific type. AMS 5105’s SWITCH 1 is programmed as normally close and its threshold is set to 0.95∙Δpini. SWITCH 2 is pro-grammed as normally open and the threshold is set to 2∙Δpini. Both ports’ hysteresis is typically set to 1 % of the calibrated pressure range, which is about 5 % of Δpini. As a consequence SWITCH 1 opens at 0.95∙Δpini for rising pressure and closes at 0.9∙Δpini for falling pressure. SWITCH 2 closes at 2∙Δpini for rising pressure and closes at 1.95∙Δpini for falling pressure. Using these settings both LEDs and S1, S2 are off if no malfunction occurred and the filter is not end of life. If the differential pressure measured across the filter exceeds 2∙Δpini LED 2 lights up and the load connected to S2 is powered indicating that the filter has to be replaced. LED 1 turns on and the load at S1 is powered if a malfunction occurs which significantly reduces the actual measured pressure difference below Δpini and the pressure difference drops below 0.9∙Δpini. These malfunctions include a failure of fan, a leak in the ducts, a ruptured or a bypassed filter. Alternatively AMS 5105’s switching ports can be programmed to window mode, see the User Guide: USB starter kit AMS 5105 [3], while the settings for the switching threshold and hysteresis of SWITCH 1 and SWITCH 2 are used as described above. In this case LED 1 indicates a properly working HVAC system and LED 2 lights up, if the filter has reached its end of life or a malfunction occurred, which reduces the actual pressure difference below 0.9∙Δpini. Example 4: HVAC Monitoring System with Diagnostics Measured at an OrificeFor this purpose the same electrical circuit as in Example 2 can be used, only the pressure measurement method is changed. Instead of measuring the pressure difference between the filter’s upstream und down-stream side, the pressure drop resulting from the air flow in the system is measured across an orifice. Using this setup the upstream filter protects the sensor from contaminants. Now AMS 5105’s pressure port 1 is connected to the orifice’s upstream side between the filter and orifice and port 2 to the orifice’s downstream side. In contrast to the examples given before, the pressure drop across the orifice decreases if the filter’s air flow resistance increases: At constant fan speed the air flow through a new, properly mounted filter is larger than the air flow through a filter, which has reached its end of life. The decreasing air flow leads to a decreasing pressure difference at the orifice. Due to the non-linear relationship between the air flow through the filter and the pressure drop at the orifice, the thresholds from the previous examples cannot be used anymore. For each specific setup the initial pres-sure difference, the pressure difference indicating the filter’s end of life and the resulting thresholds for AMS 5105 have to be determined individually. Figure 4: HVAC Filter Monitoring System with Pressure Measurement at an OrificeReferences:
|
 |